Home »
Misc »
How to calculate offensive rating in basketball
How to calculate offensive rating in basketball
Calculating Individual Offensive and Defensive Ratings
Individual Offensive and Defensive Ratings are efficiency metrics developed by Dean Oliver in his 2004 book Basketball on Paper. What follows is a basic guide to their calculation, though we encourage you to read his book for the full details and explanation of these statistics.
Offensive Rating
In Dean's words, "Individual offensive rating is the number of points produced by a player per hundred total individual possessions. In other words, 'How many points is a player likely to generate when he tries?'"
The basic building blocks of the Offensive Rating calculation are Individual Total Possessions and Individual Points Produced. The formula for Total Possessions is broken down into four components: Scoring Possessions, Missed FG Possessions, Missed FT Possessions, and Turnovers.
The Scoring Possessions formula is by far the most complex:
ScPoss = (FG_Part + AST_Part + FT_Part) * (1 - (Team_ORB / Team_Scoring_Poss) * Team_ORB_Weight * Team_Play%) + ORB_Part
where:
FG_Part = FGM * (1 - 0.![]() 2) * 0.4 * Team_FTA))
2) * 0.4 * Team_FTA))
After all of that, we can finally calculate the player's individual Offensive Rating:
ORtg = 100 * (PProd / TotPoss)
As a side note, we can also calculate what Oliver calls Floor Percentage, which answers the question, "What percentage of the time that a player wants to score does he actually score?":
Floor% = ScPoss / TotPoss
The difference between Offensive Rating and Floor Percentage, Oliver notes, is the average number of Points Produced per Scoring Possession. "Though [Shaquille O'Neal] may have a high floor percentage," Oliver writes, "his poor foul shooting means that he has a lot of one-point possessions, bringing his offensive rating down a bit. Good three-point shooters like Reggie Miller, who may not have the highest floor percentage, will have higher offensive ratings."
Defensive Rating
Just as Oliver's Offensive Rating represents points produced by the player per 100 possessions consumed, his Defensive Rating estimates how many points the player allowed per 100 possessions he individually faced while on the court.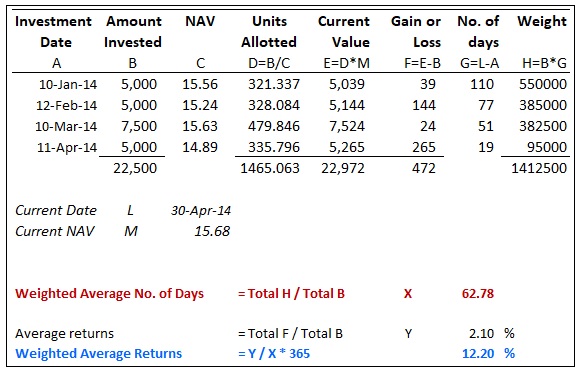
The core of the Defensive Rating calculation is the concept of the individual Defensive Stop. Stops take into account the instances of a player ending an opposing possession that are tracked in the boxscore (blocks, steals, and defensive rebounds), in addition to an estimate for the number of forced turnovers and forced misses by the player which aren't captured by steals and blocks.
The formula for Stops is:
where:
Stops1 = STL + BLK * FMwt * (1 - 1.07 * DOR%) + DRB * (1 - FMwt)FMwt = (DFG% * (1 - DOR%)) / (DFG% * (1 - DOR%) + (1 - DFG%) * DOR%)DOR% = Opponent_ORB / (Opponent_ORB + Team_DRB)DFG% = Opponent_FGM / Opponent_FGAStops2 = (((Opponent_FGA - Opponent_FGM - Team_BLK) / Team_MP) * FMwt * (1 - 1.07 * DOR%) + ((Opponent_TOV - Team_STL) / Team_MP)) * MP + (PF / Team_PF) * 0. 2) * Opponent_FTA*0.4)
Notes:
- In a later chapter of Basketball on Paper, Oliver emphasized that Offensive Ratings shouldn't be viewed in a vacuum. Introducing a concept he called "Skill Curves", he acknowledged that a player's ORtg needed to be judged in conjunction with his Usage Rate, a measure of how big a role the player fills in his team's offense. The bigger the role, the more difficult it is to maintain a high ORtg; the smaller the role, the easier it is to be highly efficient. Because of this, Oliver stressed that a player's ORtg should primarily be compared to those of other players in a similar role.
- Out of necessity (owing to a lack of defensive data in the basic boxscore), individual Defensive Ratings are heavily influenced by the team's defensive efficiency. They assume that all teammates are equally good (per minute) at forcing non-steal turnovers and non-block misses, as well as assuming that all teammates face the same number of total possessions per minute.

- Perhaps as a byproduct, big men tend to have the best Defensive Ratings (although Oliver notes that history's best defensive teams were generally anchored by dominant defensive big men, suggesting that those types of players are the most important to a team's defensive success). A corollary to this is that excellent perimeter defenders who don't steal the ball a lot — for instance, Joe Dumars or Doug Christie — are underrated defensively by DRtg, and are prone to look only as good as their team's overall defense performs.
As always, if you have any comments or questions, please send us feedback.
Understanding the NBA: Explaining Advanced Offensive Stats and Metrics | News, Scores, Highlights, Stats, and Rumors
- Facebook Logo
- Twitter Logo
- Copy Link Icon
Adam Fromal@fromal09Twitter LogoNational NBA Featured ColumnistJanuary 26, 2012
Understanding the NBA: Explaining Advanced Offensive Stats and Metrics
0 of 9
There's no such thing as a perfect statistic, but there is such a thing as the perfect application of a statistic.
While some people believe too fully that there is nothing more to basketball than the "human aspect," others realize that numbers can explain a whole lot about the action on the court. Those that embrace the numbers generally tend to see their knowledge of the game increase, but only if they know how to use the stats.
Now I do understand that some of the advanced stats and metrics can be a bit intimidating because they're unfamiliar and, in some cases, complicated. It doesn't help that we're force-fed traditional, sometimes useless stats by the media.
Every time I see someone immediately dismiss an advanced statistic because it's "useless," it kills a little part of me. No stat is worthless if you know how to use it.
The following nine slides explain the most common of the advanced offensive stats and metrics. Check back later for the defensive and overall ones.
And as always, feel free to leave any comments or questions in the appropriate section.
You can find all of these stats and more at Basketball-Reference. com, 82Games.com and HoopData.com.
Assist Percentage (AST%)
1 of 9
Calculation
100*A/(((MP/(TMP/5))*TFG)-FG)
Where A=Assists, MP=Minutes Played, TMP=Team Minutes Played, TFG=Team Field Goals, FG=Field Goals
Explanation
Leading off this guide to advanced offensive metrics in the NBA is perhaps the most basic of the stats: assist percentage. I say perhaps "basic" because it's one of many tempo-free stats, or stats adjusted for pace and volume.
While assists in themselves are kind of useful to look at, assist percentage is a much better statistic to cite when trying to make a case for a player's skill in the passing department. Assist stats can be padded by two things: the amount of time that a player is on the court and the pace at which his team plays.
A player on a fast-paced team like the Miami Heat or Washington Wizards is going to have more offensive opportunities to rack up counting stats, leading to elevated numbers of assists per game and assists per minute (which are also a better way of looking at assists than just assists by themselves).
Similarly, a player who plays 35 minutes per game is going to have more opportunities to generate assists than a player on the court for 20 minutes per game. It may seem like common sense that averaging 10 assists per game in 20 minutes of action per contest is more impressive than averaging 10 assists per game in 35 minutes of action per contest, but that distinction is lost when only assists per game is cited.
Because assist percentage is free from the effects of pace and volume, it's a better indication of how effective a player is at racking up the dimes during each and every one of the team's possessions.
The stat essentially estimates (note: estimates, not calculates) what percentage of made shots by teammates were assisted by a player while he was on the floor.
Limitations
Without looking at play-by-play data, the best this stat can do is provide an estimate of the aforementioned percentage it is meant to calculate. Additionally, there is no way to measure and give credit for good passes that resulted in missed open looks.
Just as with any assist statistic, a player is at the mercy of the skill of his teammates.
Example Usage
"Steve Nash is currently leading the league in AST% at 57.3."
How I interpret that sentence: It's pretty incredible that Nash is overcoming the effects of old age and worse teammates than he's accustomed to and still finding a way to assist over half of the field goals his team makes while he's on the court.
Turnover Percentage (TOV%)
2 of 9
Calculation
100*TO/(FGA+0.44*FTA+TO)
Where TO=Turnovers, FGA=Field Goals Attempted, FTA=Free Throws Attempted
Explanation
The second of the offensive tempo-free stats, turnover percentage, is free from the effects of tempo because it isolates the possessions in which the player in question made a box score impact.
Before explaining exactly what this stat does though, I'd like to focus on the parenthetical denominator of the above calculation: (FGA+0. 44*FTA+TO). This mathematical expression is the best way of quantifying the number of play results a player was involved in without simply going back through every box score and actually counting.
There are three ways that a player can be involved in the end result of a possession. They can attempt a field goal (regardless of whether it's a two-pointer or a three-pointer), they can end up on the foul line or they can turn the ball over. However, simply summing those three results does not provide the number of possessions because shooters can attempt either one, two or three free throws on any given possession.
Box scores don't explain how many shots a player was fouled on, so we have no idea of knowing which fouls resulted in and-ones (for example) without looking through historical play-by-play data.
Just trust on this one (I've read the studies and they're too complicated to explain in a short space) and accept the fact that the 0.44 multiplier is the best way of estimating the total number of possessions a player is involved in.
So now that we've got that out of the way, all this stat really does is calculate the number of turnovers a player will make in 100 individual plays.
Turnovers and turnovers per game are both dependent once more on pace of play and the amount of time a player spends on the court. This rate statistic eliminates those detriments and focuses solely on the percentage of times a player turns the ball over compared to the amount of times they're involved in the play.
Limitations
Turnover percentage still can't factor in the passes that a player makes that result in non-turnovers (i.e. assists or passes to other players who either miss a shot or don't shoot).
Therefore, it's still a fairly limited stat because it only focuses on the true outcomes of possessions when that player is involved.
Example Usage
"John Wall's TOV% of 18.8 is even worse than his rookie mark of 18.6."
How I interpret that sentence: After posting a pretty poor TOV% during his rookie season, John Wall is actually turning the ball over more per 100 possessions this season. That's one area of his game that he really needs to work on.
Offensive Rebound Percentage (ORB%)
3 of 9
Calculation
100*(ORB*(TMP/5)/(MP*(TORB+ODRB))
Where ORB=Offensive Rebounds, TMP=Team Minutes Played, MP=Minutes Played, TORB=Team Offensive Rebounds, ODRB=Opponents Defensive Rebounds
Explanation
Whenever a shot clanks off the rim, there are four possible outcomes: The ball could go out of bounds and be counted as a defensive team rebound; the ball could bounce of a defensive player and go out of bounds to be counted as an offensive team rebound; the ball could be pulled down by a defensive player and be counted as a defensive rebound; or the ball could be pulled down by an offensive player and be counted as an offensive rebound.
If you add up all four of those results, you account for all of the potential rebounds in a game.
Offensive rebound percentage calculates the percentage of available offensive rebounds that a player grabs while he's on the court.
This is the last of the commonly-used offensive tempo-free rate stats and much like the previous two, it doesn't account for pace or volume.
Limitations
Once more, it's too much trouble to go back and retroactively look at all historical box scores. No one really wants to do that.
Therefore, this is merely an estimate, albeit an accurate one.
Example Usage
"DeMarcus Cousins' ORB% of 16.4 leads the NBA during the 2011-2012 season, even beating Kevin Love's 12.5."
How I interpret that sentence: The big man for the Sacramento Kings grabs the offensive board nearly a fifth of the time that his team misses shots (which happens quite a bit).
Effective Field-Goal Percentage (eFG%)
4 of 9
Calculation
(FG+0.5*3P)/FGA
Where FG=Field Goals, 3P=Three-Pointers, FGA=Field-Goal Attempts
Explanation
Field-goal percentage (FG%) was once one of the better stats for estimating shooting ability up until the popularization of effective field-goal percentage in the 1990s.
The only difference between the two stats is that three-pointers are weighted more heavily in eFG%. Seeing as three-pointers are worth three points and two-pointers are worth two points, this makes sense.
That may be the most ridiculously obvious sentence I've ever written.
Don't make the mistake of thinking that the multiplier in front of three-pointers should be 1.5 though. Essentially, it is in the above formula because three-pointers are counted one time in field goals and another 0.5 times on the other side of the addition sign.
So, as for the merits of effective field-goal percentage, tell me which of the following players you'd rather have:
Player A attempts 10 shots from the field, all from within the three-point arc, and drills five of them.
Player B attempts 10 shots from the field, all from outside the three-point arc, and drills five of them.
Player A, who was responsible for 10 points, has a FG% of 50 percent, just like Player B, who was responsible for 15 points, despite shooting the same number of times. However, Player A's eFG% was still 50 percent while Player B's was a much better 75 percent.
Limitations
While I like eFG% as a stat, there is still a measure of shooting that is significantly better. If for nothing else, that's because it takes free-throw shooting into account as well, unlike eFG%.
You'll see what that stat is pretty soon.
Also, the penalty for missing a three-pointer is the same as the penalty for missing a two-pointer because all attempts are weighted the same.
Example Usage
"Ray Allen is currently leading the NBA in eFG% at 63.5 percent."
How I interpret that sentence: Ray Allen's FG% of 50.2 percent is impressive enough, but once you look at his three-point shooting prowess, his eFG% is even more impressive.
True Shooting Percentage (TS%)
5 of 9
Calculation
PT/(2*(FGA+0.44*FTA))
Where PT=Points, FGA=Field-Goal Attempts, FTA=Free-Throw Attempts
Explanation
There are three ways that an NBA player can score: three-pointers, two-pointers and free throws.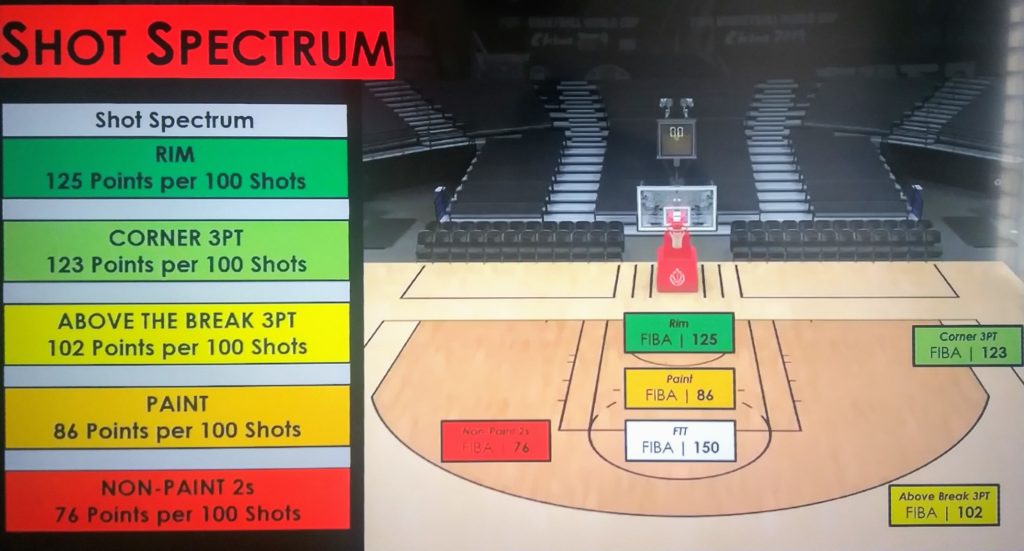 It just makes sense that the best measure of shooting percentage would take all three of those methods of scoring into account.
So, does true shooting percentage look at all three?
As you can see by the "Field-Goal Attempts" and "Free-Throw Attempts" in the calculation, TS% clearly at least takes two-pointers and free throws into account. As for the 0.44 multiplier, the same reasoning applies as did for turnover percentage. You can find the full explanation on that slide.
Three-pointers are a little harder to find in the formula, but they're still there, hidden within the word "Points." The maximum TS% is actually 150 percent and can only be achieved if a player hits each and every one of his shots and they're all from downtown. For example, if a player goes 1-for-1 and his only shot is a three-pointer, the formula will read and simplify as follows: 3/(2*1+0.44*0)) = 3/2 = 1.5.
Because this stat does take everything into account, it's easily the best measure of shooting ability we have. Just for the record, it can also be called adjusted shooting percentage, effective shooting percentage, effective percentage, points per shot attempted and scoring efficiency.
Limitations
Other than only accounting for shooting ability, and thereby not qualifying as an overall evaluation of a player's offensive ability, the only true limitation of TS% is that it's possible (although extremely unlikely) to have a TS% of over 100 percent.
Also, just like with effective field-goal percentage, all missed attempts count the same.
Example Usage
"For the second straight season, Tyson Chandler is currently leading the league in TS%, this time with a mark of 77.1 percent."
How I interpret that sentence: Chandler may not be the best shooter in the NBA, but this stat shows that he's the most efficient scorer, even though he doesn't ever make three-pointers.
His effectiveness in the paint and competency from the free-throw line elevates him significantly.
Usage Rate (USG%)
6 of 9
Calculation
100*((FGA+0.44*FTA+TO)*(TMP/5))/(MP*(TFGA+0.44*TFTA+TTO))
Where FGA=Field-Goal Attempts, FTA=Free-Throw Attempts, TO=Turnovers, TMP=Team Minutes Played, MP=Minutes Played, TFGA=Team Field-Goal Attempts, TFTA=Team Free-Throw Attempts, TTO=Team Turnovers
Explanation
This may be the most complicated looking calculation yet, but the concept behind it is really quite simple. Usage rate calculates what percentage of team plays a player was involved in while he was on the floor, provided that the play ends in one of the three true results: field-goal attempt, free-throw attempt or turnover.
On average, a player will have a usage rate of 20 percent. Think about it and it will make perfect sense.
Limitations
Only the true outcomes are measured here, so there is quite a bit left out. For example, a player like Ricky Rubio, who prefers to pass more than shoot will have a much lower USG% than a player who prefers to shoot.
Yet, a player who passes the ball is still involved in a possession in my mind.
Example Usage
"Kobe Bryant's USG% of 38.8 is the highest of his career and is leading the league in the category for the second straight year."
How I interpret that sentence: Kobe Bryant needs to pass more.
Points Per Possession (PPP)
7 of 9
Calculation
PT/(FGA+0.44*FTA+TO)
Where PT=Points, FGA=Field-Goal Attempts, FTA=Free-Throw Attempts, TO=Turnovers
Explanation
The numerator is clearly represented by the word "Points." There is really no explanation necessary there.
Per refers to the division sign.
We've already seen how possessions can be best estimated by what's written in the above denominator. The full explanation is provided on the turnover percentage slide.
This stat in its simplest form explains how efficiently a player uses his time with the ball to score. With the help of companies like Synergy, PPP can be further broken down into certain situations like isolation plays, pick-and-roll situations, etc.
Limitations
This stat only refers to scoring efficiency and there's more than scoring to basketball, even on offense.
Other than that and the fact that the possessions are estimates, there aren't too many limitations to PPP.
Example Usage
"Kyrie Irving's teammates are scoring 1.455 PPP when he passes out of isolation situations."
How I interpret that sentence: This is yet another example of how impressive Kyrie Irving's rookie campaign has been, as he's clearly recognizing the defenses he's facing and making good decisions.
Offensive Rating (ORtg)
8 of 9
Calculation
100*PP/(FGA+0.44*FTA+TO)
Where PP=Points Produced, FGA=Field-Goal Attempts, FTA=Free-Throw Attempts
Explanation
Offensive rating is just the amount of points produced by a player per 100 possessions.
Seriously. That's it.
The reason this one is useful is that it's another tempo-free stat. Offensive rating eliminates factors like pace of play and minutes played per game.
Unfortunately, I don't have access to the calculation of Points Produced. The formula can be found in Dean Oliver's book Basketball on Paper.
Limitations
Because of the estimations made in both Points Produced and the formula for possessions, this is once more just a baseline and not an exact number.
This stat also rewards players who shoot a high percentage more than anything else, which is why you'll generally see low-usage big men high up on the leaderboards.
Example Usage
"Ryan Anderson's ORtg of 127.9 is the second best mark in the NBA and further evidence that he is truly breaking out."
How I interpret that sentence: Ryan Anderson has been an incredibly efficient player this season, but his usage rate of 22. 3 percent probably has something to do with his high ORtg.
Offensive Win Shares (OWS)
9 of 9
Calculation
(PP-0.92*LPPP*(FGA+0.44*FTA+TO))/(0.32*LPPG*(TP/LP))
Where PP=Points Produced, LPPP=League Points Per Possession, FGA=Field-Goal Attempts, FTA=Free-Throw Attempts, TO=Turnovers, LPPG=League Points Per Game, TP=Team Pace, LP=League Pace
Explanation
As explained by Basketball-Reference, this is really a five-part calculation, the details of which can be found in the page hyperlinked to.
Win Shares are easily the best metric for evaluating the offensive play of a single player because it accounts for almost everything and scales the result so that one OWS is actually equal to one win added to the team's cause.
Points Produced takes all facets of the offensive game into account: points scored, assists and offensive rebounds. Moreover, the metric is tempo-free.
Limitations
Compared to the rest of the stats included in this slideshow, OWS doesn't have too many flaws. The only true flaw is that while it accounts for pace of play, it's still a counting stat of sorts.
Although different from counting stats like total points, there is still a clear benefit to players who are on the court for a lot of minutes.
Example Usage
"LeBron James has generated more OWS than any other player this season, as his mark of 3.0 clearly shows."
How I interpret that sentence: LeBron James is the best offensive player in the league.
🚨 SPORTS NEWS ➡️ YOUR INBOX
The latest in the sports world, emailed daily.
The NBA 90,000 is a fashionable numbers empire. Explaining how to use advanced statistics - openers - Blogs
Historically, statistics in sports has been taken as such a factual argument. In endless disputes and ratings saturated with subjective perception, it is cold numbers that are an indestructible foundation that is definitely not biased. The statistics take into account every possession of every match. Statistics don't hurt anyone.
The numbers certainly give accurate answers. Just not all questions. You need to put them in the right context in order to come to adequate conclusions. You need to understand what statistics take into account, and what can be missed.
One of the main components of working with statistics is, in fact, the choice of the considered metrics. Statistics are evolving and new indicators are emerging. And the game is changing, and some data is no longer as useful as it used to be.
So what statistics are relevant today? What metrics have already become obsolete? Which of the new indicators is the most useful? Let's figure it out.
Team statistics
It is more logical to start with a few banal, but important and fundamental things. Such as attacking or defensive rating and 4 factors.
Points per 100 possessions
Back in the day, teams' defense and attack were measured by points conceded or scored per match. Today, everything is a little more accurate. Instead of "per match", "per 100 possessions" is used, which is called the attacking and defensive rating . This allows you to make an allowance for the pace and not talk about the fact that any fast team cannot defend, but attack smartly.
Here's a simple example: The Bucks are now by far the best defense in the NBA, only conceding 101.6 points per 100 possessions. But in terms of points missed per game, Milwaukee is only fifth in the NBA. Why? Because they play fast enough, and the opponent simply has more attacks per match (as well as the "deer" themselves). But on any given defense, the Bucks have fewer passes than any other NBA team, so a defensive rating is clearly a more useful tool here.
Same with attacking rating, as an alternative to match points. These two indicators most simply and accurately describe the level of the team on both sides.
The difference between a team's attacking and defensive rating is called "no-rating", in fact, it is the difference in score or +/-, but in terms of 100 possessions. This metric is quite indicative and allows you to assess the strength of the team almost better than the win-loss ratio of .
The idea is something like this: if you have a lot of wins, but not the highest net rating, then most likely you suffered several big defeats, could not confidently beat weak teams and took some tight matches with a close ending, which always implies a factor chance. Naturally, this should impose a certain filter on the perception of the percentage of matches won.
Of course, Denver will tell everyone that he just plays well in the decisive minutes and rightfully wins ahead of Utah, Dallas and Houston, even though they have a higher net-rating. Only for some reason, Utah has a higher percentage of wins in games whose outcome is decided in the last minutes.
We can say that this indicator underestimates the importance of hard-fought endings and overestimates the importance of crushing matches. And we can say that it allows you to make an allowance for luck. Not always and not for everyone, “no rating” will be more objective than a simple number of wins, but when comparing teams with a similar number of wins and losses, a noticeable difference in “no rating” is definitely important.
4 factors
Attack and defense ratings are such generalized indicators that show the overall strength of the team in each half of the court. For more detail, indicators of the so-called 4 factors are very useful.
So-called, because, in fact, there are 8 of them: four in attack and four in defense. This includes effective hitting percentage, rebounding percentage, turnover percentage, and free throw frequency. Together, these indicators give a fairly complete picture of the team's game.
Effective field percentage (eFG%) measures the accuracy of shots. Previously, the base percentage from the field (FG%) was used - the number of hits from the number of shots. But with the growth in the number of three-pointers, this metric is hopelessly outdated.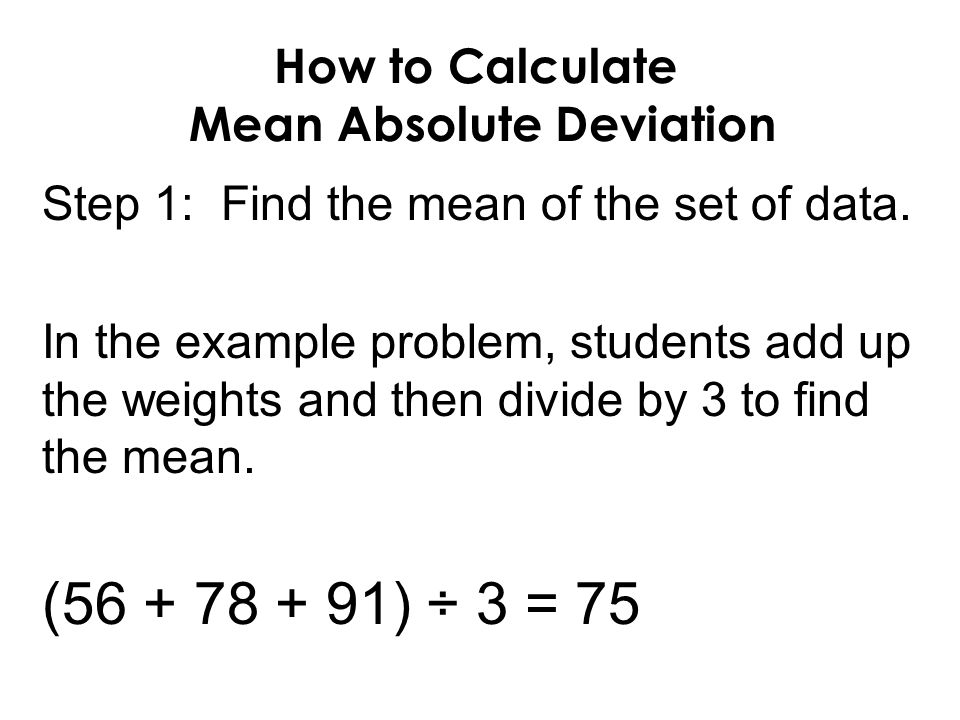 She mixes shots from behind the arc and two-pointers, which seriously hits teams that rely on three-pointers. The bottom line is that “three-pointers” are not sold so often, but they cost one and a half times more, and FG% only takes into account accuracy. eFG%, in turn, also adjusts for the value of three-pointers . In fact, an eFG% of 50 means the team scores 1 point per shot.
So, Houston is 22nd in field shooting and 6th in eFG% because almost half of their shots are 3-point shots. And, given that they have the second offense in the NBA, the advanced figure is clearly closer to the truth. eFG% allows you to noticeably more adequately assess the effectiveness of the throws of the team and the opponent.
The percentage of losses and the percentage of rebounds shows who actually had more of these shots. If you rarely lose the ball and often rebound on offense, then you are more likely to hit the ring. This can help out even with not the highest throw efficiency. Again, it is in percentage terms that such data is more useful. They allow you to count not the number of losses per match, but the number of losses per 100 possessions. Not the number of rebounds in the game, but the percentage of available rebounds. This makes more sense.
For example, Utah and Miami are near the middle of the table in losses per match. But their percentage of losses is at the level of 6-7 places in the League from the end. That's because they play very slowly and they just have fewer possessions per game, which means they're less likely to lose the ball. But in each individual attack, the chances of making a loss are quite high.
The last component of the 4 factors is the FTA rate. This is the number of shots from the line for 1 shot from the field. And this indicator kind of closes the topic. Because if the team didn't lose the ball, it doesn't mean that it definitely threw a field goal, it may have earned free kicks. This must be taken into account. But theoretically, one could remove this factor from the list by replacing eFG% with TS%. True shooting is another combined accuracy metric that takes into account the value of shots, and it includes not only two-pointers and three-pointers, but also free throws . Then the throws from the line will be taken into account. But, of course, the frequency of free throws gives a more complete picture of the game.
In general, 4 factors describe the match quite fully. As a rule, looking at them, you can determine who won, although there is no mention of points in these statistics. And, if you look at the seasonal performance of the team in 4 factors, you can quickly find out what exactly the indicators of the attacking and defensive ratings are made up of.
Distribution of throws
Now in Moscow living rooms there is only talk about the effectiveness of throws. Many are already simply sick of this efficiency, because "how much can you throw your threes. " As if if the player takes two steps forward and scores one point less, the game will immediately become still beautiful. As if, if the player opens on the middle, and not in the corner, it will become easier for his partners to go into the passages everyone loves.
In fact, the idea of efficiency is much broader. It was never "throw only three-pointers." It was always "throw lay-ups, three-pointers (preferably from the corner) and try to get free throws." And it's just a matter of mathematics. Because some attempts are more useful than others. On average, a 3-pointer from the corner earns more points per shot than a 3-pointer under 45. A lay-up promises more points per shot than a floater. A three-pointer in the forehead brings more points than a long-range average. A pair of free throws is worth more points than any field goal other than a dunk (but if you count all shots from under the basket, then their implementation is lower than free throws).
That's why the teams are trying to get to the big points in the attack and defend themselves in such a way as not to give the opponent profitable shots.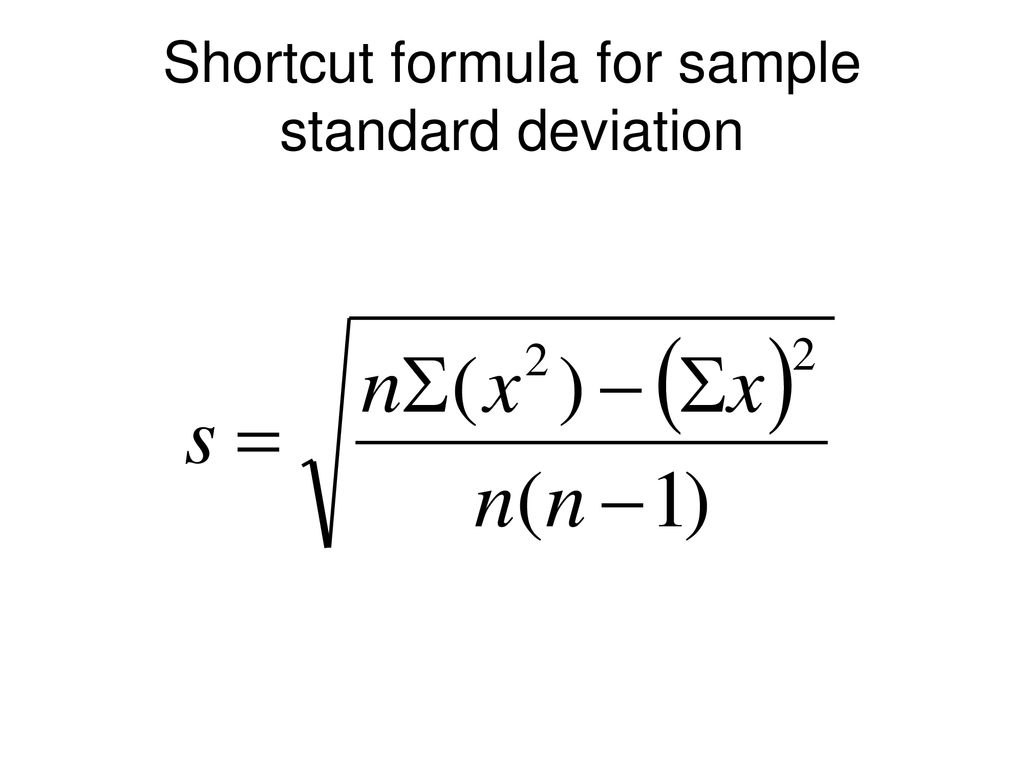 And this gives a new look at the throw card - makes it a kind of measure of success. Because the accents are now so pronounced that the ability to get the right throws is already a victory. A high number of attempts from good positions means that you are generating opportunities for correct shots, despite the fact that any opponent knows that these are the ones to try to avoid.
Of course, the set of players does not always allow you to get the most out of the situation. Chicago is the first in the NBA in shooting from under the basket, but the last in the accuracy of these attempts. “Golden State” rarely allows the opponent to throw from under the basket, but misses everything from there. Minnesota shoots a lot of three-pointers, but rarely hits them (perhaps why they are given these shots so easily). And last year's Spurs, on the contrary, constantly threw with an average, but they did it so accurately that a mathematically incorrect throw turned out to be quite effective (although it turned out to be impossible to throw with such a percentage two years in a row).
Performers are important. But they will not turn the math upside down, they can just correct it a little. The worst team in shooting from under the basket still shoots more than 62% from there, that is, 1.24 points per shot. The worst team at 3-pointers from the corner hit 33.9% of their attempts from there, which is more than 1.01 points per shot. No one in the NBA shoots above 48 percent (0.96 points per shot) from any medium range.
Any team will shoot more efficiently by coming up with the right shots. And by removing advantageous shots from your opponent, you improve your defense.
Therefore, the distribution of shots by distance and accuracy in each of the categories is one of the tools for evaluating a team in both halves. In principle, this can be used as a kind of “adjustment for luck”. If a team takes disadvantageous throws, then it should not have too high a conversion. If a team gives the opponent good shots, and he misses them, sooner or later it will end.
Quite conveniently, distance throws are presented here in the team shooting/opponent shooting section. There are share of shots, and implementation, and separate columns for three-pointers from the corner. The data can be rewound back to the year 2000 if it is interesting to see how teams threw before, and how they throw now.
Theoretically, from all this abundance of team indicators, one can even form a certain game pattern for oneself.
For example, a defensive rating would show that the Jazz and Bulls have about the same level of defense. Four factors will make it clear that "Utah" almost does not force losses, and "Chicago" - on the contrary, very much succeeded in this. The throw card will show that "Utah" does not let anyone near its ring - the opponents almost do not attack from close range, and against the "bulls" they only throw them on the way.
As a result, it is logical to assume that Gobert sits under the basket, does not meet the opponent's ball handler, and therefore does not force him to make mistakes. From here, Utah's opponents have few losses. But with such a defense, Gobert can completely block the “paint”, which is what the throw card shows. With the "bulls" the opposite is true - high pressure on the ball forces the opponent's mistakes, but in case of failure, they open both a dash to the ring and three from the corner.
But this is theoretical, because I did everything the other way around, first I looked at the games, and only then - the statistics.
What to get stuck in quarantine
This is not exactly team statistics, but it is not individual either. In general, NBA.com now has two very interesting tools for assessing the success of certain combinations of players.
For example, the impact section allows you to understand how certain players affect each other and partners. For example, you can see how Harden and Westbrook interact. Are the Rockets' no-ranking better when they're both on the floor, or when Harden plays without Westbrook? Does Russ shoot more accurately when Harden is on the floor? Does the defense get better with both of them on the bench? Does Rivers shoot more accurately playing only Harden or only playing Westbrook? Everything has already been calculated.
This is quite an important thing when evaluating team leaders. Can they play without each other? Do they make each other better? And, as a result, is it worth it to breed them by the minute?
You can also look at the influence of players from different teams in matches with each other, but here, for obvious reasons, the sample does not allow drawing conclusions (at least in the regular season). If we look at the opposition of the players, then the statistics on match-ups are more indicative. The metric allows you to see both who usually defends against whom, and how successful different players are in such matchups. For example, who LeBron attacks through most often or against whom he throws the worst. The sample is again small, but describes the extreme cases accurately. If someone can't defend against LeBron it shows immediately, if someone does a really good job it shows.
The second interesting section is lineups. All the top five in the NBA on one page. The visualization is very convenient, you can immediately see which combinations played a lot, and which ones were the most successful.
Combinations can be sorted not only by "no-rating", but also by accuracy, the efficiency of the opponent's shots and the share of shots scored in the early attack. Naturally, it is not necessary to be tied specifically to the fives - you can look at combinations of 2, 3 or 4 players.
Player statistics
Individual data is mainly compiled from three statistical sections. The first is the load, the amount of work in the attack. The second is the efficiency of this work. The third - at least something about protection.
Throws
Let's start with the engagement percentage (USG%). The metric takes into account productive attacking actions - shots, free throws and losses. USG% is the proportion of possessions in which the player made such an action during the time he was on the court (possessions spent on the bench are not counted as idle).
Basically, this reflects the shooting load, allowing you not to collect free kicks, field goals and losses separately in the corners. At the moment, the NBA leader in this indicator is Giannis, he has an engagement percentage of more than 37. That is, when he is on the floor, 37% of the Bucks' possessions end with an attack by the Greek. Which is not surprising, given his 20 field goals and 10 free throws in 30 minutes on the floor. This is the seventh most in history, above only Bryant, Jordan, Harden, Iverson and Westbrook (twice). At the same time, in terms of efficiency, only Harden is next to Giannis, the rest are noticeably lower.
As for efficiency in general, it is quite well described by the same eFG% or TS%. They make allowance for the value of the rolls and bring all the indicators together. But there are important details to consider.
Was the throw after the pass or not?
Other things being equal, it is easier to get from the transfer. It would seem that these are the problems of those who throw from the dribble, but these players are more independent, because they themselves bring themselves to the throw. They are more difficult to neutralize. But among the attacking players after the transfer, there is a certain line between really dependent players and just players of this specific type. For example, Redick shoots after a pass, but sort of goes to the throw himself. It opens so that any log can give it a pass. He doesn't need a point guard, just an average NBA player. On the other hand, it takes a certain amount of talent to flirt with some pick-and-roll centers - the point guard must pull two on the screen in order to free his big one. For different types of players, the degree of dependence is different, as is the adjustment for the fact that they attack after the transfer. Therefore, the next question is:
In which attack were points scored?
NBA.com now has a division into types of combinations.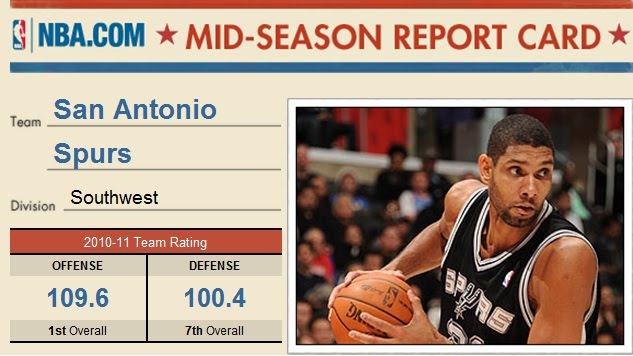 By opening a specific sub-type of attack, you can see how often the player uses it and how many points he scores for such possession.
So, different types of holdings have different efficiency. If the performer is qualified, then throws from under the basket after a partner's discount are worth more than 1.3 points per possession. Throws from top rollmen are worth more than 1.2 points per attempt. Approximately the same amount is given by "spot-up attempts" - throws after discounts, when the shooter did not open on the screen to receive, but simply remained open due to the fact that the opponent went somewhere to help. This is dependent throws. They are easy to hit because your partner creates them for you.
Of course, it should be noted that, for example, a competent type rollman attracts so much attention to himself that it facilitates the work of the ball handler and gives almost an inverse relationship. But these are particulars from the red book, they are rare in the wild, and even successful rollmen are, for the most part, dependent and easily replaced players.
But screen openings, pick-and-rolls, isolations and post-ups are possessions created by the thrower himself. They require more aggressive movements, it is already more difficult to maintain balance and withstand the mechanics of the throw, it is more difficult to hit. Hence the drawdown in terms of efficiency in the region of 1.1 points per possession from the best representatives of each of the types.
Was the throw in position or early attack?
Milwaukee is the most effective field goal shooter this season with an eFG% of 55.3. The worst team in terms of accuracy on early offense is the Clippers, who hit with an eFG% of 56.0. That is, the worst transition in the NBA is more productive than the best offense in the league. So, naturally, it is easier for players to hit in early attacks, and those who have a high share of shots in transition are initially in a winning position. And it's one thing if you're Giannis or Simmons, the player who actually creates these early offensive opportunities.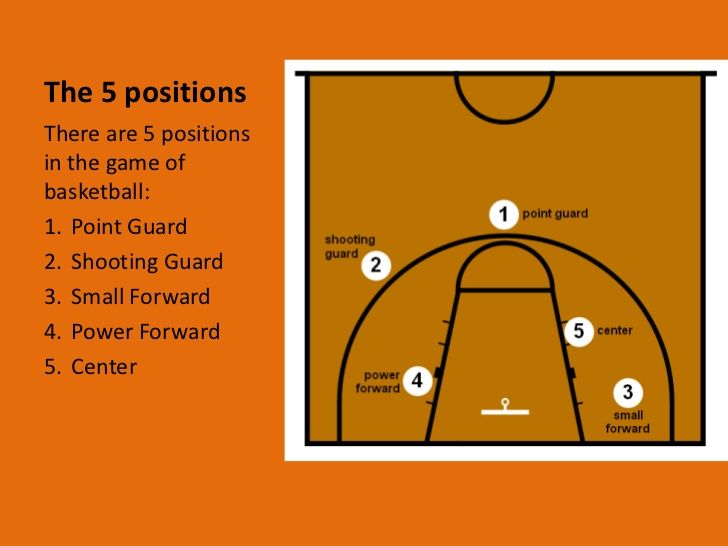 It's another matter if you're just defending at the top and when intercepted, you find yourself closest to someone else's ring. You are a good fellow for running fast, but that's all.
And the effectiveness of the players must be run through such filters. Because the most accurate basketball players will always be centers who shoot 3 times per game, and all three of their shots are dunks after the transfer of a partner. But this does not mean that they are the most effective scorers. They just have the easiest job.
Passes
The second component of the attacking load is passes. It seems logical to use the percentage of assists (AST%) . The indicator takes into account the share of partners' hits from the player's pass from the total number of partners' hits. That is, if Valera has AST% 20, and the guys who play with him on the team hit 10 times, then Valera has 2 assists. But the trick is that possessions in which the player threw himself do not count at all. Therefore, AST% is slightly higher for stars with a large throwing load, the lion's share of those shots for which they did not give a transmission are their own.
On the one hand, the assist percentage approach is logical. Because players with a high shooting load simply have fewer opportunities to give an assist - there are fewer possessions in which they pass. And it seems to be more correct to count exactly how many assists from the theoretically available ones the player has given, and he cannot give an assist to himself.
On the other hand, if you are constantly throwing, then the possessions that your partners hit are stupidly smaller, and it is easier to have a high share of passes there. So part of the lack of focus on the pass will make your percentage of assists higher, which does not sound very logical. In general, the metric is ambiguous and favors players who dominate the ball.
If you need to calculate a purely passing load, then it is more appropriate to take "effective passes per 100 possessions. " In essence, this is the percentage of team attacks that ended with a pass from a player. Adding this to the percentage of engagement, you can roughly estimate the total load in the attack. Then a large throwing load will be taken into account, and players who throw rarely will not be pinched.
But the engagement percentage takes into account not only hits, but also all throws, and even losses. To add to it exclusively assists is not logical.
Potential assists will come to the rescue - passes that did not lead to a hit, but to a throw (naturally, including hits) .
This is especially handy if you're Trae Young, playing with hand-assers who can't hit anything. In assists per 100 possessions, you will be inferior to Doncic or Rubio, but you will be higher in chances created. And this is important, because point guards, who play with weak finishers, are initially in losing positions, and then they are pulled up.
On the other hand, this metric plays into the hands of guys who are just so bad at passing that it's impossible to shoot properly from their pass. Westbrook has more potential assists than Harden, and James has more actual assists. And any Oklahoma fan who has seen how a real point guard should play this season knows what it is.
In any case, in order to somehow use this metric, you need to wait for NBA.com to allow you to see data in terms of 100 possessions, and not “per game”.
As for the effectiveness of transmissions, it is considered by different methods, but not all.
Ancient as the world option - the ratio of transfers to losses . But, like everything ancient, this metric is rather raw. Such statistics will always favor players who aggravate little for themselves and are aimed precisely at the draw. Because surprise is surprise, the ball can be lost not only when trying to pass. Rubio has a better pass-to-loss ratio than LeBron, not because he's a better passer, but because LeBron does a lot of other things besides passing, and that's where you can lose the ball.
Today there are still not too perfect, but already more interesting methods. For example, thanks to tracking, you can find out what percentage of a player's passes were successful (AST to PASS%). Here, of course, you need to compare only those who at least sometimes pass. But, in general, the tool is working and shows how aggressively the player sharpens.
More complete data available (AST to PASS% adjusted) . This takes into account the percentage of passes that led not only to a hit, but also to free throws or an assist (that is, hockey assists are counted). When it comes to players with a high overall playload, this is probably the most logical tool for evaluating passing performance. No, not because Booker and Young are higher than LeBron in this indicator. It's just that this metric shows what part of the programs are really aggravating.
But that number doesn't really honor 3-point passes. The chance that a discount on a long shot will be effective is initially lower, simply because of the conversion percentage, so the percentage of passes that turn into assists will be lower. But a three-pointer is more expensive. From this point of view, it is more logical to use the points scored after the player's passes. But this, in turn, has nothing to do with efficiency, because it does not take into account the proportion of successful transfers from the total amount given. This is not to mention the fact that on the official website of the NBA, again, this data is available only in the “per match” format, which is unfortunate. For, as already mentioned, such indicators do not allow accurate comparison of basketball players who receive different playing time and play at different paces.
In general, the transmission data has become more interesting, but there are still no clear answers.
Barriers
Well, for the "big" ones, involvement in the attack is decently reflected by screen assists. The screens that lead directly to a scoring shot show how often attacks actually go through those screens. Rudy Gobert is a recognized champion in this regard, he puts on 7 screen assists per match.
True, there are questions related to how much it is in the player setting the screens.
First, Adams is doing 5 screen assists per match this season, down from 3.4 the year before. You think it's Westbrook? If you rewind even further, there will again be 5 screens resulting in an average per game. And a year before that - again about 3.5. This indicator strongly depends on the game of the team. If they do pick-and-rolls that lead directly to the shot, then you will have a lot of effective screens. If not, then alas. Gobert tops screen assists not because he's a great screener, but because Utah plays through his screen every attack. How could it be otherwise, because if Rudy does not put up a barrier, then in attack it is just a useless piece of wood under the ring.
Secondly, the ability to make a screen is highly dependent on the player using the screen. For example, whoever Lillard is currently playing with, that “big” screen assist stat will be fine. Not only because Dame hits his pick-and-rolls over and over again, but because he does it so damn well.
In general, as an indicator of the quality of the screens, this metric is not very good. But as an indicator of the integration of the "big" into the attack - quite .
Protection
For a long time there were no sensible defensive statistics , and nothing has changed since then . Fans had to get by with blocked shots and interceptions, which were more bright manifestations than a reflection of real contribution.
But over time it got a little better, additional indicators appeared that are already more useful. And all the equally meaningless data appeared.
For example, attempts to rethink block shots and interceptions with a fashionable percentage of blocks or counting deflections (ball touches in defense) were initially doomed . Because they think the same thing just a little differently. And the problem with block shots and interceptions was not in the scoring model, but in their nature. These are rare tangible manifestations of defense, but they are not the goal, the mission of defense is to force a bad roll. A block shot or an interception is more of a random consequence of a good defense. Well, Minnesota is in the top 10 this season in both steals and blocks per 100 possessions. I think it's not worth reminding where their protection is.
At the same time, it should be noted that good defensive players often ended up in the top in steals or deflections. It's just that there were also weak defensive players who took risks in an attempt to catch the interception. And their failures were not taken into account by statistics, but their successes were very much so. It's the same with players who cheat block shots by getting knocked out on every swing.
But with the development of tracking, it became possible to track the "protective percentage of the game" . And it became a real revolution, because now it was possible to clearly track which player through a certain distance hit the worst. What's more, this percentage was compared to the attacking player's average hitting percentage, so you can see how much the defender reduces the opponent's effectiveness.
So, the protective percentage under the ring showed who was the best rim protector. Today - Brook Lopez (5+ shots, 30+ matches).
And everyone was so happy, but this theme only really works for centers .
Because the centers protect the hoop from everyone. The center is almost impossible to hide in defense. And the perimeter players defend in their position. Therefore, they try to hide weak defensive players on someone harmless, and this allows these weakest defensive players to have a good defensive percentage. It's like telling what a historically tough guard Harden is in the post, like he's defending there against Embiid or other really post-up "big guys" that aren't that many in the NBA today. No, it's just that Harden is exchanged for the “fourth”, and then this “fourth”, who has not played with his back for two years, decides that it is his duty to trample Harden. James really does this.
By the way, you could look at the defensive types of possessions and evaluate the number of points a player misses in a given possession. But pick and roll defense is the work of at least two people. Only protection against isolations and post-ups can really be assessed. And not only is this far from the entire defense, but there is not a single player in the league who has played at least 30 matches and defends in aizo or post-up at least 2 times per match.
In general, it is statistically difficult to assess the individual level of protection, even if we are talking about a banal one-on-one game.
Another sort of defensive indicator is defensive rebounding. And I just can't understand why anyone else cares about this indicator . Well, yes, if the ball is tossed, it will fall, and you caught it, great job. What is the value of the fact that it was you who caught the ball, and not your teammate? How many of your rebounds were actually snatched from the opponent and had any value? Today, defensive rebounds are like an attacking possession in which you didn’t allow a loss – that’s how it should be, there’s no need to count them.
Offensive rebounds look a little more interesting, but they tend to depend on the style of play and coaching attitudes. The pick-and-roll "big" chasing the ballhandler will often clean up after him. If the defensive center of the opponent is traded for the perimeter, then the attacking center has a height advantage in the fight for rebounding. And if you play for Popovich, then you can’t pick up rebounds in the attack - you need to immediately run to the defense. But there is at least something, focus on the rebound, instincts, hustle. There is nothing in defensive rebounding, as in individual metrics. Drummond collects 40 of them per match, no one cares.
But it got better over time. Accountants began to record not only the rebounds themselves, but also box-outs, now you can find out how many of the player's rebounds were torn out in the fight. Or to see that Drummond, who collected 10 rebounds on defense only last season, had no effect on Detroit’s team defensive rebounding, and Vucevic this season with 8. 5 rebounds on his shield, but with elite boxing numbers. strikeouts and rebounds with resistance - turns the work of "Orlando" on the shield.
Of course, defensive rebounding remains a relatively team topic because it is influenced by a lot of things. For example, a player can simply immediately run to the attack, forcing the opponent not to rebound, but to return to defense. The fact that the little one did not exchange on the perimeter, but worked on his feet and allowed the center to return under the ring to fight for rebounds, also has some value. But now there are more factors to know the real impact of a player on rebounding. And, in fact, the number of rebounds themselves is not important here at all.
Finally, one could evaluate the player's defense by looking at the defensive rating, but this never works because it depends heavily on the combinations the player comes out with. The very idea of assessing the individual level is lost.
In general, only the “big” players with their “paint” defense and influence on rebounds have decent defensive statistics today.
Something to get stuck in quarantine
There has always been a burning desire in the NBA to create some one indicator that would unequivocally explain who is the best player in the world. Previously, these were PER and WinShares - indicators that significantly overestimated the centers. Although MVP is still usually won by the person with the highest PER, John Hollinger's player performance rating.
Then there were more advanced and just other things: BPM, VORP, RPV, RPM, PIE and I made up one of these abbreviations.
Every time it's something new, and every time there are players who can hack the formula, like the centers once hacked PER (seriously, Whiteside is the 10th NBA player by this metric, John Collins is 13th, Mitchell Robinson - 14th, Wood - 16th, Harrell, Valanchunas and Drummond - close the twenty). Each new indicator has its weak point, because of which the formula overestimates someone. And, if the glitches of this metric are shoved into the top of someone superfluous, then how can you be sure that it adequately placed the non-superfluous in order?
In general, finding the perfect formula is rather utopian. But it gives an alternative view, and allows something to be rethought a little. From the latest developments, the RAPTOP metric from 538 looks quite interesting.
In general, the development of statistics in recent years is encouraging. Now it is no longer a thin brochure, but a huge library in which you can dig for hours. The current statistics already have many more answers, and we are already accustomed to asking them many more questions.
But, of course, without context, these are still just numbers. Basketball VKontakte , Tom Pennington
Basketball statistics: where to look and how to apply?
Basketball statistics play an important role. It helps analysts and bettors to learn patterns, current trends, latest trends, to study all the indicators of teams and athletes, to predict the possible result of the match and the total. Many novice players are wondering, where to look for basketball statistics , what parameters exist and how to use them. The answers to all these questions are available in this material.
What about statistics in basketball?
As you know, the team consists of the main five and reserve performers. Each basketball player plays in his own position. Two athletes are assigned to weak zones, so that at any moment the coach has the opportunity to strengthen the position by releasing fresh blood.
There are three positions in basketball:
- Forward.
- Center.
- Protector.
Each performer has certain skills, the application of which on the site leads to a set of indicators. They determine the player's level and relate to statistics:
- Points.
- Gears.
- Interceptions.
- Block shots.
- Rebounds.
- Losses.
- Fouls.
- Free throws.
- Implementation of 2 and 3-point shots.
Basketball statistics. Where to looking for?
There are really a lot of useful sites with statistics on basketball games on the Internet. We tried to choose for our readers the most effective projects that have been operating on the Web for a long time and provide users with reliable information. In addition, statistics are also provided by legal bookmakers. Which of the bookmakers offers the best line and extensive list, read here.
Sports.ru and NBA Stats
The Sports.ru domain has been launched since 1998. This is a sports publishing house that reviews sports in all its manifestations. More than 7 million users visit the portal per month. Relevant materials are published as quickly as possible so that readers are aware of updates from the world of sports.
Ordinary registered users have the opportunity to create their own blog and write about anything. All sports disciplines are covered. Not only news is added, but also interesting collections, polls, notes, videos, etc. In addition, a separate section dedicated to the NBA has been introduced. Most likely, this is a page with statistics from the official supplier - the National Basketball League website, that is, the information here is as accurate as possible. If you do not want to visit the aforementioned Russian-language portal, you can immediately go to the link: stats.nba.com.
These are not just numbers, signs, symbols. The second column is the basketball players. The third is the team they play for. It's three letters because it's an abbreviated name. For example, POR - Portland Trail Blazers, ATL - Atlanta Hawks, DAL - Dallas Mavericks, MIN - Minnesota Timberwolves, etc. The fourth column is the number of games played (G - Games). Fifth - matches in the starting lineup (GS - Games Started). Now let's take a closer look at other points:
- PPG - Points Per Game - Points per game.
 Other sites may have the abbreviation PTS, which stands for points (points).
 - RPG - Rebounds Per Game.
- APG - Assists Per Game - Assists.
- MPG – Minutes Per Game – Minutes Played.
- EFF - Player Efficiency Rating - Player Efficiency Rating.
- FG – Field goal percentage
- 3P - 3-point - Percentage of 3-point shots made.
- FT - Free Throw Percentage - The percentage of free throws converted.
- DEF - Players Defensive Impact - The effectiveness of defensive actions.
- SPG – Steals Per Game – Interceptions.
- BPG - Blocks Per Game - Blocks (block shots).
- PF - Personal fouls - Personal fouls.
There is an option to use a filter by statistical indicators. For example, you need to determine the TOP-5 best basketball players in the league by rebounds, etc.
This is not a complete list of statistical parameters. Only the main ones that are important when predicting basketball matches. There are also additional elements. A complete glossary is available on Wikipedia or on the official NBA website. It is very important for novice bettors to understand the main indicators, as well as to watch live matches in order to understand what the essence of the game is.
Annabet and 24score
Two very similar projects. Both cover the results and statistics for several sports at once:
- Football.
- Basketball.
- Hockey.
- Tennis.
- Handball.
- Baseball.
- Volleyball.
- NFL.
Website 24score is a more advanced site. In addition to results, standings, face-to-face confrontations and upcoming matches, the resource offers statistics on totals, halves, and quarters.
Dozens of championships from different countries are available, as well as top tournaments: Euroleague, NBA, VTB United League, World Championship, etc.
A less popular and less popular project is AnnaBet . There are plenty of championships, but there is much less useful information for those who bet on basketball. True, there is one useful feature - a graph that displays the current game form of the teams.
MSN Sport
The project was implemented on the Microsoft News platform. Two sections related to basketball are available to readers and forecasters:
What the site owners offer:
- Results.
- Calendar.
- Current news.
- Detailed team and player statistics (NBA only).
Convenient filter by statistical indicators. Moreover, the entire abbreviation has been translated into Russian, and when you hover over the desired element, the full transcript is displayed. For example, SBI - made shots from the field, %SB - the percentage of free throws.
SlamDunk
Another useful basketball resource. The project has been operating since 2000. Updates continue to this day. Both Russian and world basketball, NBA, women's basketball are covered. Here you will find:
- News.
- Video.
- Discussion topics on the forum.
- Tables.
- Results of previous meetings.
- Calendar of upcoming games.
- Statistics on tournaments and basketball players.
For which competitions the "Statistics" section is provided:
- Euroleague.
- WBT United League.
- NBA.
What indicators are available for analysis:
- Points.
- Rebounds.
- Gears.
- Interceptions.
- Block shots.
- Number of minutes played.
This information is enough to make a competent forecast for the basketball confrontation.
Sofascore
Online resource SofaScore provides users with a lot of useful information:
- More than 70 basketball leagues.
- Statistics for all tournaments.
- Online results.
- Line-ups.
The data is updated automatically. Add a championship to your favorites and keep an eye on what's happening in the regular season or playoffs.
The site is filled with requested information. For example, select the match you are interested in and in the "Statistics" section you will find not only the number of blocked shots and assists, but also other interesting indicators, for example, the number of timeouts, whether there was overtime, how many points the teams scored, how many were in the lead in total separately hosts and guests, rebounds in attack and defense, etc.
Statistics on the websites of bookmakers
Very often, players do not have to use third-party resources. By choosing a reputable and high-quality bookmaker, a person gets at his disposal all possible betting tools. These include sections "Results", "Statistics", the "Bet Buyback" function, live video broadcasts, bonuses, promotions and much more. We are interested in statistics. It is available on the websites of most legal betting companies. To get to this section, you must select the item of the same name in the main menu. We analyzed the sections of statistics from different bookmakers and formed a bookmaker rating that provides detailed statistics, and not just the result of games and the standings:
- Match Center BC Liga Stavok.
Three bookmakers at once have weaker (much less useful statistical information) and the same software that produces statistics:
The same amount of information, but on a different engine, is offered by the FonBet bookmaker.
Conclusion. How to make a basketball prediction based on statistics?
It's time to sum up the intermediate results and answer the question of how to make a competent forecast for a basketball game, having so many useful resources in hand.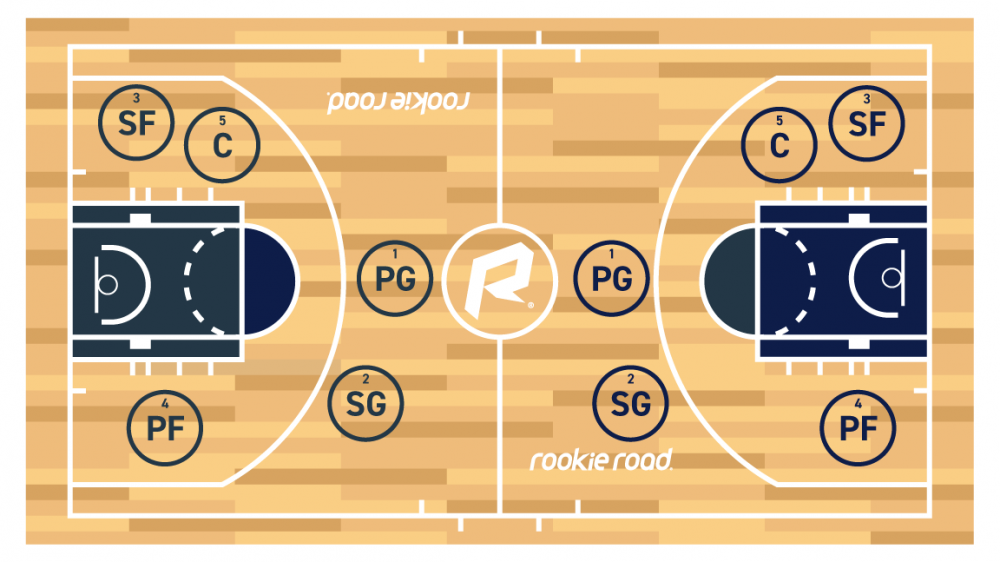 It is necessary to compare the statistical indicators of the two teams, find out about the current form, the presence of motivation, previous results, face-to-face confrontations, and also thoroughly study the line-ups of the teams.
It is important for defensemen to consider rebounds, interceptions, blocks, turnovers and fouls. For attackers - the implementation of shots from the field, the implementation of free throws, assists, fouls and losses. For centers it is important to consider everything, but the most important thing is the accuracy and efficiency of the transfer.
Such an analysis requires a lot of free time, but this approach will allow you to form the most objective and accurate forecast for basketball.
5, February 2020
No comments
Bukmekerov.net is a site about bookmakers in Russia (primarily) and the CIS in general. We specialize in legal companies. We write without censorship.
We DO NOT accept bets, DO NOT sell predictions, DO NOT encourage gambling in any form.