Home »
Misc »
How to predict college basketball games
How to predict college basketball games
The ultimate guide to predictive college basketball analytics
You’re smarter than the typical college basketball fan. You hear about sports analytics and want to know more about how it applies to college basketball.
Maybe it’s November, and you’re looking to bet a few games as states continue to legalize sports betting. Maybe it’s March, and you need an edge in winning your NCAA tournament pool.
This article covers the basic concepts in college basketball analytics such as points per possession and the four factors. It does so by asking two questions:
- How do you make a prediction for a game?
- Do matchups matter in predicting a game?
The article ends with a curated list of further reading. This list covers the randomness of the three point shot, ensemble methods for making predictions and how to win your March Madness pool
Let’s dig in.
1. How to make predictions based on points per possession
Let’s suppose Gonzaga and Michigan State face off in the NCAA tournament championship game.![]() You want to make a prediction for this game based on data.
You want to make a prediction for this game based on data.
The first thing to consider in making a prediction is the pace of play. Gonzaga likes to get up and down the floor, while Michigan State prefers the half court game.
Based on this style difference, it doesn’t make sense to look at points per game. For a more accurate estimate of team strength that considers pace, the analytics community looks at points per possession.
While it’s trivial to get the points in a game, the box score does not provide the number of possessions. Let’s look at how to estimate this number.
1a. Estimating possessions
To estimate the number of possessions in the game from the box score, let’s consider how a possession can end.
One way for a possession to end is a turnover (TO). The box score tracks each turnover, so each turnover counts as one possession.
Next, consider possessions with a field goal attempt (FGA). A possession ends after a field goal attempt in two situations:
- the offense makes the shot
- the offense misses the shot and the defense gets the rebound
The possession could get extended if the offense grabs the rebound (OREB). To account for these 3 situations, we estimate possessions with a field goal attempt by FGA – OREB. Offensive rebounds get subtracted because the offense can take two shots on one possession if they get an offensive rebound.
A possessions can also end with free throws. If every free throw came in a pair because of a shooting foul, the number of possessions would be half the free throw attempts (FTA). Unfortunately that’s not always the case, as the offense can:
- get one free throw after a made basket
- get three free throws when fouled on a three pointer
- miss the front end of a one-and-one
Instead of a half, you need a different factor that accounts for these situations. Ken Pomeroy uses 0.475, and I use this factor in my calculations as well.
To estimate possessions (POSS) from the box score:
POSS = FGA – OREB + TO + (0.475 * FTA)
In college basketball, teams could differ in the number of possessions by two if one team gets an extra possession each half. To estimate the possessions in one game, you apply this a formula to both teams and take the average.
During the 2019-20 season, college basketball teams averaged about 70 possessions per game. Gonzaga was one of the faster teams, as they averaged 74 possessions per game. Michigan State played an average pace of 70 possessions.
It’s possible to get a more accurate possession count through play by play data. This also presents an interesting opportunity to eliminate possessions at the end of games with intentional fouls, as they don’t reflect the normal flow of play.
1b. Ranking college basketball teams
To evaluate college basketball teams on offense and defense, we use points per possession as an efficiency metric. The last section showed how to estimate possessions from the box score.
During the 2019-20 season, college basketball teams averaged 100.5 points per 100 possessions. The offense gets about a point each time they have the ball.
To get from points per possession to college basketball rankings, you need to adjust for strength of schedule. College basketball has a wide range of teams, and every fan recognizes the difference in playing Michigan State versus Mississippi Valley State.
There are many ways to adjust for strength of schedule. Here, I’ll focus on the methods of Ken Pomeroy, as his college basketball rankings are the most widely known.
To adjust for strength of schedule, Pomeroy uses the least squares method. This is also the basic idea behind linear regression, the data science technique most often used to find the correlation between two variables. For a visual primer on regression, click here.
This least squares method also drives the team rankings on the Sports Reference sites. They call it the Simple Rating System (SRS), and this method assigns a rating to each team in college basketball. The difference in the rating between two teams gives a prediction for a future game.
To perform this calculation, the computer changes the ratings for all 353 teams until the ratings meet a criteria. This criteria is that these ratings minimize the error between the prediction from the ratings and actual game results.
Pomeroy takes it one step further as he considers offense and defense for each college basketball team. Instead of 353 variables, his code changes 706 variables to minimize the error to the efficiency by points per possession in games.
Since these variables get solved for simultaneously, the offensive rating for Gonzaga depends on 705 other offensive and defensive ratings. Michigan State’s defensive rating matters to Gonzaga’s offense, even if Gonzaga and Michigan State have yet to play.
In his calculations, Pomeroy puts more weight on recent games. After performing these least squares calculation, you get the offensive and defensive rankings on kenpom.com. These two numbers get combined into his team rankings.
Now let’s see how these adjusted efficiency numbers imply a prediction for a game.
1c. Making a prediction
With offensive and defensive ratings based on points per possession, we can now make predictions for games. Let’s use Gonzaga against Michigan State as an example.
First, consider what the offensive and defensive ratings mean. For example, if Gonzaga has a rating of 115 points per 100 possessions, then they are expected to score 115 points per 100 possessions against an average college basketball defense.
As another example, Michigan State might have a defensive rating of 90 points per 100 possessions. This means that they’re expected to allow 90 points per 100 possessions against an average college basketball offense.
To make a prediction between Gonzaga’s offense and Michigan State’s defense, you have to consider that Michigan State’s defense is much better than average.
To do this, consider the deviation of a team’s rating from average. To simplify the math, let’s use an average efficiency of 100 points per 100 possessions.
Gonzaga’s offense is 15 points better than college basketball average, but Michigan State’s defense is 10 points better than average, both per 100 possessions. Better defenses have lower ratings.
A common way to make a prediction is that Gonzaga’s offense will score 5 points per 100 possessions better than average. This is because 15 (Gonzaga’s deviation from average on offense) minus 10 (Michigan State’s deviation from average on defense) is 5. This is the same method I use with yards per play and success rate in football predictions at The Power Rank.
Gonzaga is predicted to score 105 points per 100 possessions against Michigan State. If you scale this efficiency to 70 possessions for a game, this implies Gonzaga will score 73.5 points.
You can do same calculation for the other matchup. Suppose Michigan State’s offense has a rating of 111 while Gonzaga’s defense has rating of 93 (both measured by points per 100 possessions). You can work out that Michigan State’s offense is predicted to be 4 points better per 100 possessions. This implies 72.8 points in a game with 70 possessions.
Based on these hypothetical numbers, Gonzaga would be predicted to win by 0. 7 points.
While I have assumed 70 possessions in this game, you could assume a different number, especially if Gonzaga plays faster than average. With this method, there is clear freedom to adjust for pace.
Get my March Madness cheat sheet
At The Power Rank, I use data and analytics to make better football and March Madness predictions.
If you sign up for my free email newsletter, you’ll get:
- my March Madness cheat sheet that makes it drop dead easy to fill out your bracket
- a sample of my best football and college basketball predictions usually saved for paying members of The Power Rank
- updates on content like this guide to college basketball analytics
To sign up, enter your best email and click on “Sign up now!”
2. Do matchups matter?
During the 2019-20 season, West Virginia was an elite offensive rebounding team. In contrast, Texas was an awful at defensive rebounding, worst in the Big 12.
When West Virginia plays Texas, do they have an edge due to this matchup? Can we use this to make a better prediction?
Jordan Sperber of Hoop Vision has done excellent work on matchups.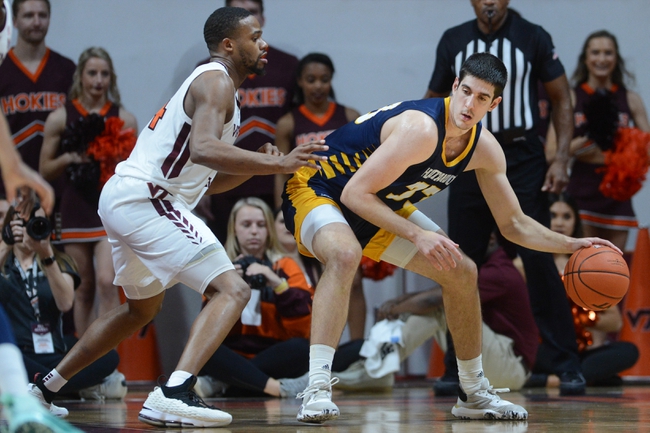 To understand his results, let’s look at the four factors of basketball, which provides a quantitative method to look at matchups.
2a. Four factors
Dean Oliver was a pioneer in basketball analytics. In 2003, he first published his book Basketball on Paper that laid the groundwork for future work in basketball analytics.
In the book, he wondered what factors made an offense great. Shooting is an obvious asset, but what else matters? Oliver wrote down four factors:
- shooting
- offensive rebounding
- turnovers
- getting to the foul line
Let’s examine these four factors in more detail and how to define a rate statistic for each.
The first of the four factors is shooting, as an offense can’t score without making baskets. The most simple measure of shooting is field goal percentage, or field goals made divided by field goal attempts.
A better formula for shooting gives the offense more credit for a three point shot. Effective field goal percentage assigns this extra 50% credit for a three. In college basketball, the average effective field goal percentage is about 50%.
The second factor is offensive rebounding, as the offense keeps a possession alive with an offensive rebound. Total offensive rebounds is not a good measure though, as this depends on the shooting accuracy of the opponent.
Instead, consider the offensive rebounding rate, or the fraction of rebounds the offense gets on that end of the court. This offensive rebounding rate is offensive rebounds divided by the sum of offensive rebounds plus the opponent’s defensive rebounds.
In college basketball, the average offensive rebounding rate is about 28%. Since the defense grabs the other rebounds, the defensive rebounding rate is 1 minus the opponent’s offensive rebounding rate.
The third factors is turnovers. A team can’t score if they commit a turnover before taking a shot.
To measure turnovers, consider turnover rate, or turnovers divided by possessions as estimated from the box score. On average, college basketball teams turn over the ball on about 19% of possessions.
The final factor is getting to the foul line. Since college basketball averages a 70% free throws percentage, taking two free throw attempts is an efficient means to score points.
To measuring getting to the foul line, one metric is free throw attempts divided by field goal attempts. In college basketball, this rate is about 32%.
It’s also reasonable to define this factor as free throw made divided by field goal attempts. This definition includes the ability to make free throws in addition to getting to the foul line. However, I’ll use free throw attempts to isolate the ability to get to the foul line.
Oliver’s four factors explain offensive efficiency, or points per possession, almost exactly. To explain this, I’ve run a linear regression on the four factors to explain points per possession on the team level. This process assigns a weight to each of the four factors.
When you do this analysis for college basketball, the four factors explain 98% of the variance in offensive efficiency.
Based on this regression analysis, which of the four factors is the most important? Shooting is the most important of the four factors, not any kind of surprise. Offensive rebounding and turnovers have about the same importance but less than shooting. The least important factor is getting to the foul line.
2b. Extremes in matchups
With these four factors, let’s get back into the question of whether matchups matter in making predictions. In 2013, Jordan Sperber wondered whether a team that excelled in one of the four factors would have an advantage over an opponent weak in the opposing factor.
In particular, can you make a better predictions based on West Virginia’s excellence in offensive rebounding and Texas’s weakness at defensive rebounding?
To study this, Sperber isolated games in which teams had extremes in rebounding. He defined an extreme as a team in the top or bottom 10% in offensive or defensive rebounding rate.
With both elite and awful units, there are four types of games:
- an elite offense versus an elite defense
- an elite offense versus an awful defense
- an awful offense versus an elite defense
- an awful offense versus an awful defense.
Sperber isolated games with these matchups and asked how well adjusted offensive and defensive efficiency can make a prediction in each game, as discussed in the previous section. He compared this prediction with the actual efficiency in the game.
For example, his data set had 311 games with an elite offensive rebounding team versus an awful defensive rebounding team. In looking at the efficiency prediction versus what actually game efficiency, the average difference was less than a point per 100 possessions.
The prediction based on offensive and defensive efficiency was able to explain the outcome of these games. Here is the main result from his study: Sperber found the same predictive accuracy in all four types of matchups.
He repeated the study on the other three factors and found the same result. The efficiency prediction was equally accurate in each of the four types of matchups.
Here is the take home message: team level matchups in the four factors do not help in predicting the outcome of a college basketball game. In some sense, the matchup is already considered in the efficiency numbers. You can see this from how well the four factors explain efficiency.
Don’t extrapolate these results too far. If your team plays a six foot three inch center, he’s probably going to get killed by Joel Embiid. However, based on the four factors, matchups do not help you make better predictions. Offensive and defensive efficiency by adjusted points per possession does an excellent job.
3. Further reading
Need more college basketball analytics? Check out these resources for further reading.
3a. The three point shot
The three point shot is a powerful weapon. It gives the underdog an opportunity to get hot and pull off the upset. It has also propelled a favorite like Villanova to two NCAA tournament championships.
Ken Pomeroy wondered whether the offense or defense has control over the three point shot. To study this, he looked at the correlation from early to late season statistics in conference.
He found that the defense has the ability to control what type of shots an opposing offense takes. Defenses can limit the fraction of shots an opponent takes from three.
However, the defense has no control once the offense puts up a three point shot. Randomness plays a big role in determining three point percentage allowed.
Even more surprising, randomness also plays a big role in an offense’s three point percentage. While shooting is a clear skill, the data shows regression to the mean in three point percentage.
To read Pomeroy’s article on the three point lottery, click here.
I’ve also looked at the randomness of three point shooting for NBA players. To check out that study, click here.
3b. Ensemble methods to predict the tournament
Nate Silver has published predictions for the NCAA tournament at both the New York Times and his own site FiveThirtyEight. The key to accurate predictions are ensemble methods that combine many predictors.
First, Silver combines 6 different power ratings to get an estimate of team strength. Each system has its weaknesses, but the combination provides a powerful predictor.
In addition, Silver adds an unexpected component: the preseason AP poll. It might seem strange to add a predictor that has no access to data from the current season.
However, the preseason AP poll is a powerful predictor of tournament performance that harnesses the wisdom of crowds. No one sports writer submits the perfect ballot, but the combination of many sports writers gives an accurate assessment of team strength.
In fact, my article on FiveThirtyEight has shown that the preseason polls are a better predictor than the RPI, the outdated computational method the selection committee previously used to seed the field.
An earlier article on these NCAA tournament predictions inspired the ensemble approach I use for my member predictions at The Power Rank. This includes college football and the NFL in addition to college basketball.
To check out the methods behind Nate Silver’s NCAA tournament predictions, click here.
3c. How to win your March Madness pool
Armed with analytics and win probabilities, you’re ready to win your March Madness pool. However, you should not simply pick the higher ranked team in every game.
This favorites strategy gives you the highest win probability for small pools. But in some years, there is a more optimal strategy for intermediate sized pools.
Sometimes, the public gets overexcited about a team, such as the 2015 Kentucky team that entered the tournament undefeated. As the numbers suggest, suppose you also pick this team as champion.
If this favorite wins, you and many others will get the 32 points for picking the correct champion. With so many other people in contention, it’s likely someone will get lucky in earlier rounds and beat you.
Instead, you should make a contrarian choice of a different team with a high win probability but not getting picked in many pools. If this team wins, you have a great chance to win your pool.
I explain these ideas in my book How to Win Your NCAA Tournament Pool. I’ve posted the Introduction here at The Power Rank. To check out the entire book for less than the cost of a latte, click here.
Get my March Madness cheat sheet
At The Power Rank, I use data and analytics to make better football and March Madness predictions.
If you sign up for my free email newsletter, you’ll get:
- my March Madness cheat sheet that makes it drop dead easy to fill out your bracket
- a sample of my best football and college basketball predictions usually saved for paying members of The Power Rank
- updates on content like this guide to college basketball analytics
To sign up, enter your best email and click on “Sign up now!”
How To Predict The Final Score
I have a program that can do this pretty automatically, but you can do it on your own!
There are five steps to finding the final score of any game:
1. Find each team's (adjusted) Offensive and Defensive Efficiency (their Points Per 100 Possessions) - from kenpom.com
For Example:
Duke's Offense - 115.4
Duke's Defense - 80.7
North Carolina's Offense - 119.8
North Carolina's Defense - 87.6
2. Find out where the game is being played. If it's a neutral game (not at either team's court), you don't have to adjust the data - you can find this at any sports website, but at kenpom.com, if you click on a team, then click schedule, you can tell if it's (H)ome, (A)way, or (N)eutral
For the home team, add 1.4% to their offense, and subtract 1.4% from their defense.
For the away team, subtract 1.4% from their offense, and add 1.4% to their defense.
For Example:
Duke's Home Offense = 115.4+(.014x115.4)=117.02
Duke's Home Defense = 80.7-(.014x80.7)=79.57
North Carolina's Away Offense = 119.8-(.014x119.8)=118.12
North Carolina's Away Defense = 87.6+(.014x87.6)=88.83
3. Find each team's adjusted pace (Possessions per game), and the League Average Pace from Kenpom. com's stats page
Duke's Pace = 71.5
North Carolina's Pace = 76.3
League Average = 67.6
Multiply these together, and divide by the league average.
Duke vs. UNC Pace = 71.5 x 76.3/67.6 = 80.7 possessions
4. For each team, multiply their Offense with their Opponent's Defense, then Divide by the League Average
League Average (just so happens to be)=100 points (per 100 possessions)
Duke's PPP=Duke O vs. UNC D=117.02x88.83/100=103.95 points per possession this game
North Carolina's PPP=UNC's O vs. Duke's D=118.12x79.57/100=93.99 points per possession this game
5. Multiply the predicted PPP (from #4) by the predicted game pace, and divide by 100 to get the final score
Duke's Points=103.95x80.7/100= 84 points
North Carolina's Points=93.99x80.7/100= 76 points
I still think UNC will win, though. :)
Ok, so....why does this work?
It actually has to do with fractions canceling out. Let's find out why:
The adjusted numbers are actually based on percentages. For example,
UNC's adjusted offensive efficiency is found by doing the following:
UNC's Avg Offense/Opponents' Avg. Defense x The League Avg Offense/Opponent's Avg Defense x Your Opponents' Average Defense
What this gives us is 3 numbers:
1. UNC's % of offense vs. opponents' defense
2. the league average offense% compared to UNC's opponents' defense
3. and the opponents' defense.
The first number tells us how well UNC has played against their opponents. The second tells us how an average team would play against UNC's opponents. Thirdly, again, we have the opponents' defense. If a team plays worse than the average team, they should be ranked lower accordingly. That's how the adjustments work.
When we cancel out the opponents' defense from the equation, we are left with:
UNC's average offense x the league's average efficiency / UNC's opponents' average defense. Look familiar? It's the opposite of our efficiency prediction calculation. (This calculation, by the way, works the same with defense, and pace. )
)
Now: the predicted efficiencies. Let's explain the opposite.
When UNC plays Duke, we compare UNC's offense to the average team, then Duke's Defense to the average team. The formula here is:
UNC's offense/League Average Defense x Duke's Defense/League Average Offense x Average Efficiency of all teams. This accurately portrays how UNC plays against the average, combined with how Duke plays against the average, in percents (since they are percents of the average, we then multiply by the league average).
This cancels out in much the same way, giving us UNC's Offense x Duke's Defense / League Average Efficiency.
There you have it!
How long is a college basketball game? Game Time NCAA
Basketball games are always an attraction at every level. Fans are interested not only in professional tournaments, but also in student basketball.
The Junior Basketball Tournament is organized by the National Collegiate Athletic Association (NCAA). The time depends on the level of the match.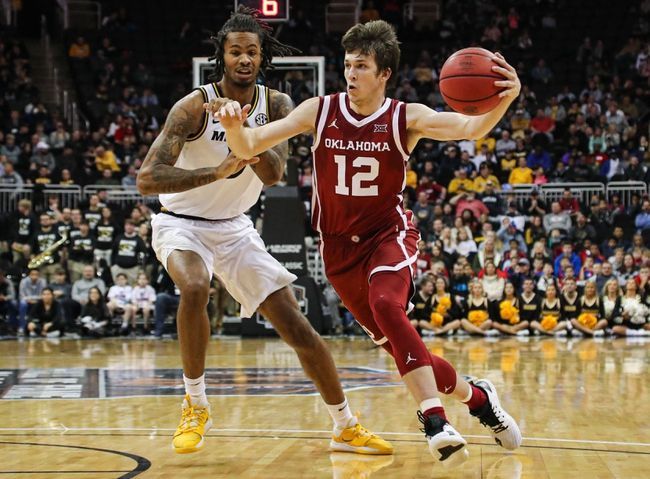
How long is a college basketball game ? The total playing time is about 2 hours 10 minutes.
A college basketball game consists of two halves of 20 minutes each. The halftime interval for NCAA games is 15 minutes. Overtime in college basketball is 5 minutes.
If you're still wondering about the duration of different tournaments, let's find out with Scott Fujita in this article.
Men's college basketball game
How long is a college basketball game on TV? With a total of two halves of 20 minutes each and a 15-minute break, a standard college basketball game should be 55 minutes long.
However, the total length of a TV match is often much longer. longer than that. Most NCAA matches last 2 hours and 10 minutes.
With that in mind, we have 40 minutes for the actual game, two 30 second timeouts for each team and three total timeouts. Total time 48 minutes.
One exciting thing you should note is that college games are typically 8 minutes shorter than NBA games. Despite this, the average length of live NCAA matches is less than a few minutes. The number of time-outs and the frequency with which teams shoot free throws during and after college basketball games are major causes of this problem.
Unlike NBA games, there are no quarters in men's college basketball games. . This means fouls will last an inning and not much time to reset. The more fouls a player commits, the longer the game lasts and the length of the game increases.
Each men's college basketball team will have four time-outs in a basketball game. Three of them lasted 30 seconds and only one timeout lasted 60 seconds.
They should have used a time-out in the first half, otherwise they would have conceded. The second half provides that each team can only stop the game three times.
In addition to the time-outs and half-times, four sets of TV waiting times are scheduled for each round. Their name "stop" appears on 16, 12, 8 and 4 in every game. If there is no stop at one of these four stages, it will be ignored.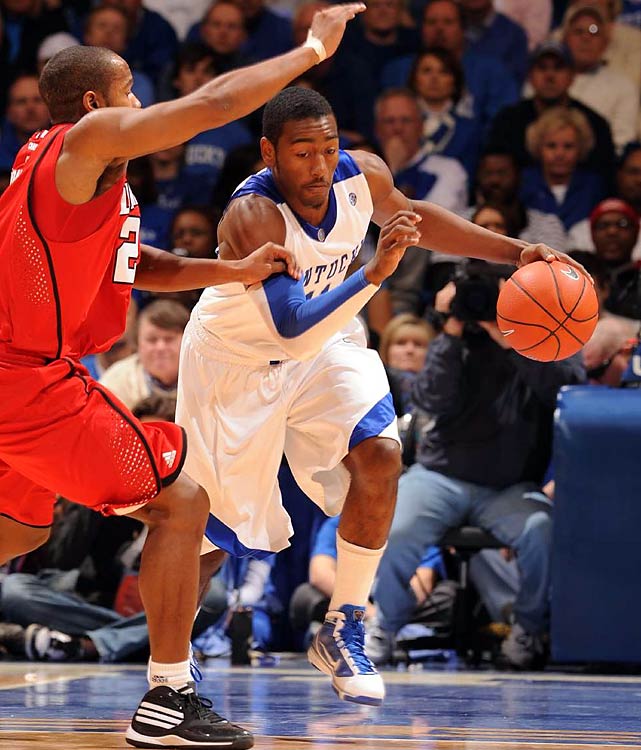
Read more:
- How long is the NBA break
- How long is the basketball court
- How long is an NBA game
How long will the women's college basketball game last? Unlike a men's college basketball game, women's games typically last 2 hours with four 10-minute quarters.
Women's basketball games used to last as long as men's. In 2015, new rules changed the format of the game. The use of four quarters is entirely in line with other major leagues. These matches also include a break between the 2nd and 3rd half.
During the game, each team is allowed about four time-outs, similar to the men's game. Despite this, there are no restrictions on when women's groups can use them.
Longest NCAA basketball games of all time In addition to the longest NBA game, some people are curious about the longest NCAA game in history.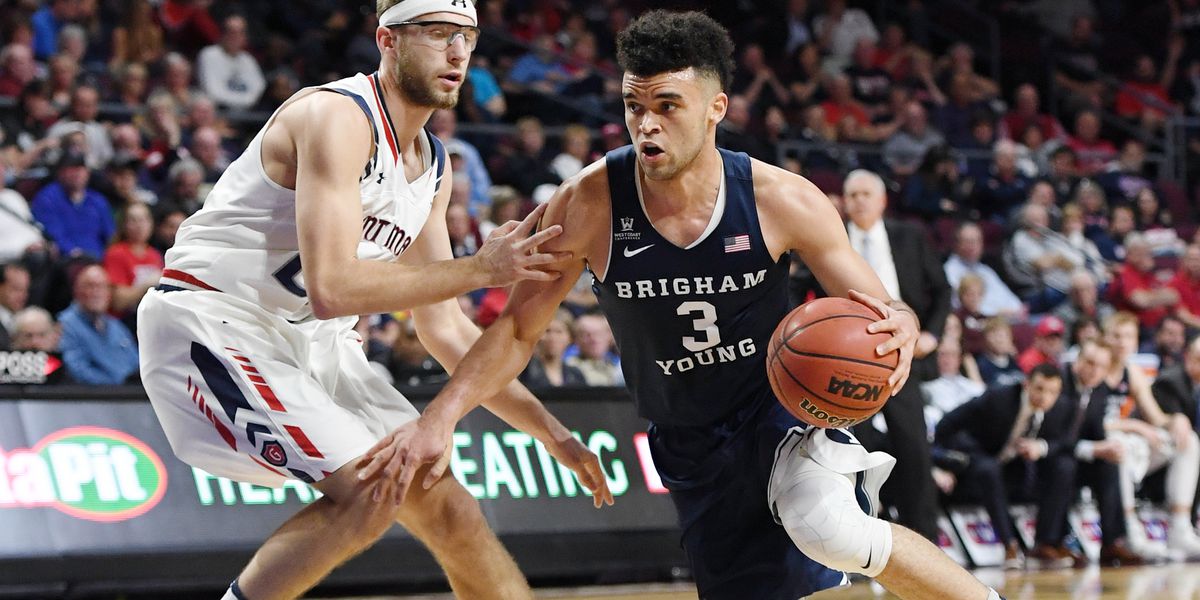 Let's find out in this section.
Bradley Vs. Cincinnati
Bradley vs. Cincinnati (1981) The basketball game between Bradley and Cincinnati on December 21, 1981 was the longest NCAA game. After six innings, both teams were tied. It wasn't until the 7th overtime that Cincinnati got the better of Bradley.
This match lasts about 4 hours, from 19:30 to 11:20. Interestingly, the score in this match was relatively low, 75-73.
Connecticut Vs. Syracuse (2009) On March 12, 2009, Connecticut faced Syracuse in a game that went to the sixth overtime in the quarterfinals of the Big East Men's Basketball Tournament.
Syracuse were the winning team with a score of 127-117. The match lasted a total of 3 hours and 46 minutes. You can watch a recording of this college game here.
How long is an NBA game? A typical NBA game usually lasts 2 to 2.5 hours. . This number is not fixed as many factors can directly affect match times.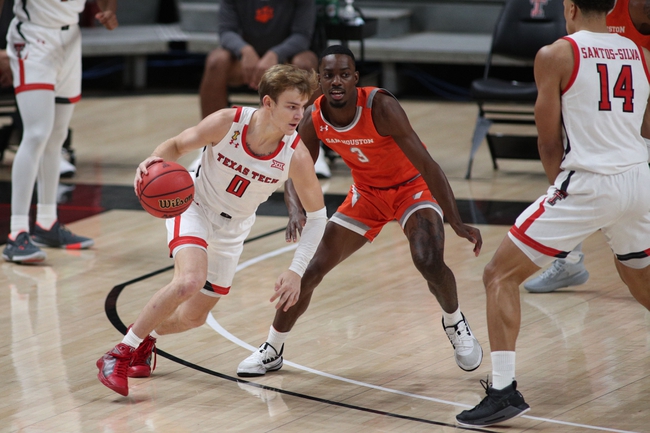
The National Basketball Association (NBA) specifies that each round of an NBA basketball game must be approximately 12 minutes long. With four games, the total playing time will be up to 48 minutes. Extra time of these matches lasted 5 minutes.
There will be a 15-minute break between rounds 2 and 3, but this is only theoretical. Some issues can cause a basketball game to last longer than expected, up to about 2 hours in a real game. Compared to FIFA games, these matches last longer.
How long will FIBA games last? The International Basketball Federation (FIBA) stipulates that each basketball game will consist of four quarters. With a total playing time of 40 minutes, each basketball quarter will last 10 minutes. We see that the duration of FIBA basketball games is slightly shorter than the duration of NBA games.
This tournament also establishes the following break rules:
- Each team is given 20 minutes to prepare before the start of the competition
- There will be a short break of 2 minutes between the first and second half.
- In order for both teams to change the field and proceed to the next half, the break between the 2nd and 3rd half is 15 minutes.
- Break between the 3rd and 4th quarters - 2 minutes.
- There will be a break of 2 minutes in extra time.
- If both teams play four quarters without finding a winner, they will go to extra time. The team with the most points in the first overtime wins.
- Otherwise, the two teams will continue to play in the next extra time.
When the FIBA end-of-round alarm goes off, the half-time break will begin.
How long is a high school basketball game?
High School Basketball Game
Under NFHS rules, a high school basketball game will have four quarters. Each round lasts 8 minutes with a 10 minute break in between.
People don't usually use clocks for school games. However, there is still a rule that graciously turns the game clock running if a team leads by a certain number of points in the second half. This rule only applies in a few states.
Each state has different rules, so there will be different criteria for time regulation and clock management.
Junior basketball game lasts less - 1 hour 30 minutes. These matches also span four quarters of 6 minutes each. In some states, the playing time for each quarter may be up to 8 minutes.
The break is 10 minutes long and junior basketball games usually don't have a shot clock. If the allotted time runs out and the two teams are still tied, 5 minutes will be added.
How long is a junior basketball game? Youth basketball games will last about an hour. These matches usually consist of 2 halves of 20 minutes each. Unlike other leagues, running clocks are used in the youth basketball game. This type of clock does not stop except for halftimes and timeouts.
The interval between games is about 10 minutes. In addition, when a team requests a time-out, the match time is extended by 4 minutes. Since the main audience is children, we must take into account the period in order to calm down and hold our ground.
Youth basketball games don't usually have a long running time, so in some situations the score may be tied.
Closing thoughts How long does a basketball game last on average? It will be difficult to give a general answer as the timing of each match will vary depending on the rules of the tournament. A playoff game also typically runs longer than a regular season game due to the longer promotional period.
A college basketball game lasts from 1.5 to more than 2 hours, depending on many factors. Knowing the playing time will make it easier for spectators to watch the game.
to victory through defeat. What you need to know about the future premiere of Britain
Rishi Sunak: to victory through defeat. What you need to know about the upcoming premiere of Britain
Photo: BBC News
In the previous battle for the leadership of the Conservative Party, former financial analyst and finance minister Rishi Sunak came in second. On the second try, he managed to win and thus become the first British Prime Minister of Asian origin.
Seven weeks after losing his first Conservative Party leadership contest of the year, Rishi Sunak was able to win his second. After his only remaining rival in the fight announced her withdrawal from the race, he was the only participant in it who received the required 100 votes of his fellow party members, and, accordingly, the winner.
Sunak thus becomes the leader of the Tory party, who, upon completion of the formalities, will become the first ever British Prime Minister of Asian descent.
In August, former finance minister Rishi Sunak was one of the favorites in the race for the prime minister's seat vacated by Boris Johnson's resignation in July.
However, he failed to convince the members of the Conservative Party then: they bet on Liz Truss - and, as it turned out, they were mistaken.
- Britain in crisis. How Liz Truss managed to break the system in a week
Who is Rishi Sunak and what kind of leader can he be? During the summer campaign, Sunak focused mainly on the UK economy, proposing plans for its recovery from the crisis.
Sunak told the BBC at the time that he would rather lose the race for the lead than "win with false promises" - a clear nod to tax cuts promised by rival Liz Truss.
- UK Conservative Party leadership battle and premiership: Rishi Sunak wins first round
Truss eventually became premier, but her sweeping proposals for tax cuts without specifying where to get the money caused such a panic in the markets, that a month later they had to be recalled.
As a result, the attempt to become the new Thatcher cost Liz Truss the premier post.
Rishi Sunak did not comment on the recent market turmoil, saying he was running for prime minister to bring the country out of a "deep economic crisis" and to unite the Tory party.
On Sunday, he was supported by "crisis" Treasury Secretary Jeremy Hunt, appointed by Liz Truss in an attempt to stem the unrest in the market. According to Hunt, Sunak will make "the choices necessary for our long-term prosperity. "
"
ANALYSIS Nick Eardley , Chief Political Correspondent
Rishi Sunak will take over as prime minister at an extremely difficult time for the economy
After the summer campaign for the leadership of the Conservatives, which he lost, we have not heard from him any detailed plans.
He will now be required to be clear about how he intends to balance the country's books.
The political pressure for the general election has not gone away either. Opposition parties are demanding them, and some Conservative MPs have said they believe they are necessary.
But seven weeks after losing the election as Conservative leader, Rishi Sunak will have the keys to Downing Street.
The inbox on his desktop looks not only swollen, but intimidating.
Sunak became Chancellor of the Exchequer in February 2020 and within weeks was faced with the task of managing the UK economy amid the onset of a pandemic and prolonged lockdowns.
To many, this non-drinking and relatively young man - 40 years old during the first lockdown - seemed to be a reliable and firm hand at the helm.
In the spring of 2020, he pledged to do whatever it takes to help the country weather the pandemic and announced £350bn in support for citizens and businesses. His personal rating in the polls went up sharply.
However, the UK economy was still stormy. Sunak himself was fined by the police in June 2020 for violating the lockdown rules on Downing Street.
In April, some conservative critics questioned millionaire Sunak's understanding of the magnitude of the rise in the cost of living that the British are facing.
At the same time, Sunak and his family's finances were in the public eye - as were the tax affairs of his wife, Akshata Murthy, who owns a substantial stake in her father's Indian company Infosys and received more than £10m in dividends last year.
She was accused of tax evasion in Britain under the pretext of being a non-resident, and in order to ease the political pressure on her husband, Murthy announced that she would start paying taxes in Britain on her overseas income.
Labor asked if Sunak ever benefited from tax havens.
The Independent suggested that he did, citing a report that he was listed as a beneficiary of trusts in the British Virgin and Cayman Islands in 2020. Sunak's spokesman stated that he did not acknowledge the allegations.
Rishi Sunak Age: 42 years old
Place of birth: Southampton
place of residence: London and Yorkshire
Education: Winchester College, University University, Stanford University
Family: married two daughters
Ulek (Yorkshire)
Sunak's parents are Indians who came to the UK from East Africa.
He was born in Southampton at 1980, where his father was a general practitioner and his mother owned and operated a pharmacy.
He attended an elite private school, Winchester College, and spent the summers working as a waiter in a Southampton restaurant. Sunak then went to Oxford to study philosophy, politics and economics.
While studying for an MBA at Stanford University, he met his future wife Akshata Merti, daughter of Narayana Merti, an Indian billionaire and co-founder of the huge IT services company Infosys.
The couple has two daughters, whom Sunak often mentioned in the context of climate change during the previous election campaign. Asked about global warming during a BBC televised debate, he once said he listened to the advice of his young daughters, who are experts on the subject in his home.
From 2001 to 2004, Sunak worked as an analyst at Goldman Sachs and later as a partner in two hedge funds.
He is considered one of the richest MPs, but does not publicly comment on his wealth.
Sunak's wealth and his education at a prestigious private school were also often discussed.
Sky News host Kay Burley asked him how he reacted to claims that he was too rich to be prime minister. In response, Sunak recalled that inflation hits all citizens, and that, unlike Liz Truss, his program in the last election of the Tory leader provided primarily for helping the poor.
In 2015, Sunak became Member of Parliament for Richmond, Yorkshire, and took a low profile position in Theresa May's government. Her successor, Boris Johnson, appointed him chief secretary of the treasury.
In February 2020, he was appointed Treasury Secretary and initially strongly supported Johnson, but then resigned, saying he believes his own approach to the economy is fundamentally different from that of the prime minister.
- Two key British government ministers resign
On the campaign trail, Sunak said he was loyal to Johnson, but resigned because his government was "on the other side" of serious ethical issues.
Sunak is a Brexiteer and voted for the UK to leave the EU. In an interview with the Yorkshire Post, he said he thought it would make the UK more free, fair and prosperous.
Another reason that prompted him to vote for Brexit was migration.
"I believe that competent immigration can benefit our country. But we must control our borders," he said.
Sunak voted three times for Theresa May's proposal for a divorce from the EU when it was submitted to Parliament.
Identity matters Sunak belongs to a generation of immigrant descendants born in the UK but with roots in other countries.
According to him, this identity matters to him.
In an interview with the BBC in 2019, Sunak said: "In terms of cultural education, I went to the temple on the weekend - I'm a Hindu - but I also went to football on Saturdays."
In an interview, he said that he was lucky - as a child he did not encounter manifestations of racism, but there was one incident that he remembered for the rest of his life.
"I was just hanging out with my little brother and little sister, I was pretty young, I was probably about fifteen, we were in a fast food restaurant and I just looked after them. There were people sitting around, this was the first time, when I encountered it, they said very unpleasant things. The P-word (a slang term for people from Hindustan). And it was painful. I still remember it. It stuck in my memory. You can be insulted by differently."
However, he added that he could not imagine such a thing happening in the UK today.
"I will fly to Kyiv" "If I become prime minister, I will redouble our efforts and strengthen our policy of all-round support for Ukraine," Sunak promised during the summer campaign.
"If I become Prime Minister, I will redouble our efforts and reinforce our policy of total support for Ukraine that Boris has so ably led."https://t.co/mvofksmPYq
Sign up 👉 https:// t.co/3cXn1rFhca pic.twitter.com/6jwE2MbF0h
— Rishi Sunak (@RishiSunak) July 18, 2022
"President Zelensky, brave citizens of Ukraine, rest assured that no matter what happens here in the coming weeks, the United Kingdom will remain your strongest ally," he said.
Sunak promised that his first foreign visit as prime minister would be to Kyiv.